

S&P 500 bull market: drivers, history and outlook
Review the latest Weekly Headings by CIO Larry Adam.
Key takeaways:
- Current bull market return ranks as third strongest dating back to 1945
- History suggests fifth year of bull market brings solid returns
- Fundamentals suggest current bull market continuing to move forward
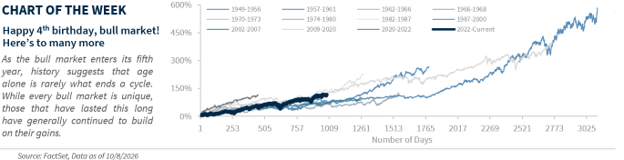
On October 12, the current S&P 500 bull market turns four years old and enters its fifth year, a milestone reached only seven other times since 1949. Despite a steady stream of concerns, including tariffs, Middle East tensions and rising interest rates, the bull market has remained remarkably resilient, climbing higher on the back of strong economic growth and solid earnings growth. Importantly, history suggests bull markets that reach year five have often delivered favorable returns. Below, we compare the current bull market with past cycles, highlight the key leaders behind the market’s advance and assess whether the rally still has room to run.
How the current bull market compares with history
While the current bull market celebrates its fourth birthday next week, the average bull market lasts about five and a half years. Yet there has been nothing average about this one. The S&P 500 has gained approximately 117% on a price return basis, surpassing the historical average of approximately 90% and ranking as the third-strongest bull market since 1945. Along the way, it has produced 124 record highs, more than double the average (approximately 50) of the seven prior bull markets that lasted at least four years. Despite those outsized gains, volatility has remained below average, with just two corrections of 10% or more (versus an average of approximately five corrections in prior bull markets). More importantly, the rally has been fueled by improving fundamentals. Next twelve-month (NTM) earnings have climbed approximately 90% since the bull market began, the second-strongest earnings per share (EPS) growth at this stage behind only the 2002 bull market, while valuations have expanded just 20%. Put simply, earnings growth, not multiple expansion, has been the primary engine of returns.
All sectors have participated, but technology leads the way
While all 11 S&P 500 sectors have delivered positive returns during the current bull market, technology has been the undisputed leader. From a price-only perspective (excludes dividends) the tech sector has surged 260%, outpacing the next-best performer, communication services (+195%), by approximately 65%, while no other sector has topped a 100% gain. Powerful secular growth drivers, led by the AI megatrend, have fueled much of this outperformance. As a result, technology now represents more than 40% of the S&P 500's market capitalization, up from 26% when the bull market began and 34% at the end of 2025. Importantly, consensus estimates project the sector will generate approximately 38% of S&P 500 earnings by 2027, versus 22% at the start of the bull market, reinforcing our constructive outlook. Just as notably, earnings growth has largely kept pace with share prices, helping valuations remain attractive over time. After peaking at a 31.1x NTM P/E in October 2025, the highest level since May 2002, the sector's valuation has normalized to its 30-year average of 21.5x.
History remains on the bull’s side
While the average bull market lasts about five and a half years, history suggests this cycle may still have room to run. Bull markets that make it into a fifth year have generally continued to generate positive returns, and the last one to reach four years but not five ended in 1957, nearly 70 years ago. Historically, the fifth year of a bull market has delivered average returns of approximately 13% and has been positive nearly 90% of the time. The post-midterm election backdrop also provides a potential tailwind. Since 1942, the S&P 500 has returned an average of approximately 15% in the 12 months following a midterm election and has finished higher after all 21 midterm elections. While history never guarantees future results, the historical backdrop remains encouraging.
Strong fundamentals point to further upside
Consistent with history, our bull market checklist points to continued gains. The US economy continues to show limited recession risk, while earnings growth remains exceptionally strong for this stage of the cycle, with consensus forecasting 15% S&P 500 earnings growth in 2027. AI spending trends remain a powerful tailwind, with tech earnings expected to increase 41% in 2027, while earnings growth continues to broaden across the rest of the market with eight of 11 sectors expected to post positive EPS growth. This strength should be on display during the 3Q26 earnings season, which begins next week. Meanwhile, valuations have become less concerning as earnings growth has driven the S&P 500's forward P/E ratio below its prior 10-year average. The two biggest risks remain higher interest rates and elevated investor optimism, with equity allocations at their highest level since December 2017. Still, sentiment can stay elevated for long periods, and both the economy and earnings have proven resilient in the face of higher rates. As a result, we believe strong earnings growth and attractive valuations will be the key driver of market performance.
Bottom line
As the current bull market enters year five, history and fundamentals continue to point in a favorable direction. With economic growth holding up, earnings remaining strong, and AI-driven investment trends intact, we expect the S&P 500 to climb to 8,450 over the next 12 months (approximately 9% upside from current levels).
All expressions of opinion reflect the judgment of the author(s) and the Investment Strategy Committee and are subject to change. This information should not be construed as a recommendation. The foregoing content is subject to change at any time without notice. Content provided herein is for informational purposes only. There is no guarantee that these statements, opinions or forecasts provided herein will prove to be correct. Past performance is not a guarantee of future results. Indices and peer groups are not available for direct investment. Any investor who attempts to mimic the performance of an index or peer group would incur fees and expenses that would reduce returns. No investment strategy can guarantee success.
Economic and market conditions are subject to change. Investing involves risks including the possible loss of capital.
The information has been obtained from sources considered to be reliable, but we do not guarantee that the foregoing material is accurate or complete. Diversification and asset allocation do not ensure a profit or protect against a loss.
The S&P 500 Total Return Index: The index is widely regarded as the best single gauge of large-cap U.S. equities. There is over USD 7.8 trillion benchmarked to the index, with index assets comprising approximately USD 2.2 trillion of this total. The index includes 500 leading companies and captures approximately 80% coverage of available market capitalization.
Sector investments are companies focused on a specific economic sector and are presented here for illustrative purposes only. Sectors, including technology, are subject to varying levels of competition, economic sensitivity, and political and regulatory risks. Investing in any individual sector involves limited diversification.