How has 2023 been to Your Portfolio?
We are basically at the end of the third quarter in 2023 as I write this, which means 2024 is right around the corner! So, with only about three months to go till the end of the calendar year I’d like to take you down a somewhat technical explanation of what has transpired in the stock market (represented by the S&P 500) so far and what that may mean for the portion of your nest egg that is invested in equities.
Earlier this year, the people at CNBC came up with a new sort of “index” to track the progress of seven stocks (Apple, Microsoft, Tesla, Nvidia, Meta, Alphabet, and Amazon) which they cleverly dubbed “The Magnificent 7”. Leave it to them to come up with new ways to get people to talk about whatever they want us to talk about. Remember that it is their and other members of the media’s job to keep us tuned in. That is how they make money. Which is why the headlines will often include words like surge and soar or plumet and sink to describe the day’s price movement in a stock, index, commodity, you get the point. Of course, once everyone’s attention is directed to the soup du jour, currently the Magnificent Seven, people start to pay close attention to the stock price moves and are more likely to want to buy those stocks (FOMO is a real thing, just ask your kids). If history is any guide, it tells us that when investors all rush together toward the same idea(s) you get what is commonly referred to as a “crowded” trade. At that point, the easy money has usually been made.
The S&P 500 is a popular index that is made up of 500 companies. The movement of these stocks has an impact on the movement of the S&P 500, but their representation is not equal. In other words, each company does not represent 1/500 of the index. Far from it. The movement is calculated using the relative weigh ng (market value) of each company relative to the other 499. In other words, Apple with a roughly 3 trillion dollar market value has 10 times the impact on the movement of the S&P 500 as compared to say Bank of America which has a market value of roughly $250 billion.
Now that you know this information, the following chart may be more impactful. It shows what your return this year would be if you had owned the S&P 500 minus the Magnificent 7. So, I guess we can call this index the “S&P 493”:
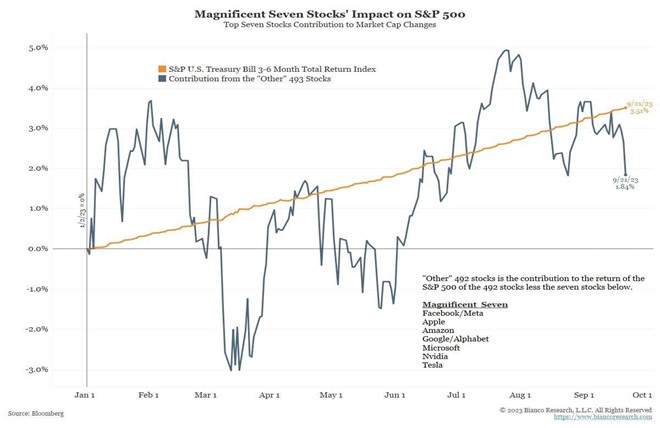
You can see that being in cash equivalents has outperformed the fictious S&P 493 thus far in 2023. If you would like to discuss how your portfolio is positioned, please feel free to reach out.
The information on has been obtained from sources considered to be reliable, but we do not guarantee that the foregoing material is accurate or complete. Any information is not a complete summary or statement of all available data necessary for making an investment decision and does not constitute a recommendation. Prior to making any investment decision, please consult with your financial advisor about your individual situation. Any opinions are those of the author, and not necessarily those of Raymond James.
This article was written by Gus Vega, Certified Financial Planner, Total View Advisors and Branch Manager with RJFS. He can be reached at 786.264.4954, 9155 S. Dadeland Blvd. # 1014, Miami, FL 33156. Total View Advisors is not a registered broker dealer and is independent of Raymond James Financial Services, Inc. Securities offered through Raymond James Financial Services, Inc., member FINRA / SIPC. Investment advisory services offered through Raymond James Financial Services Advisors, Inc.